Concept project
SaaS Analytics Dashboard in Next.js with SVG Charts
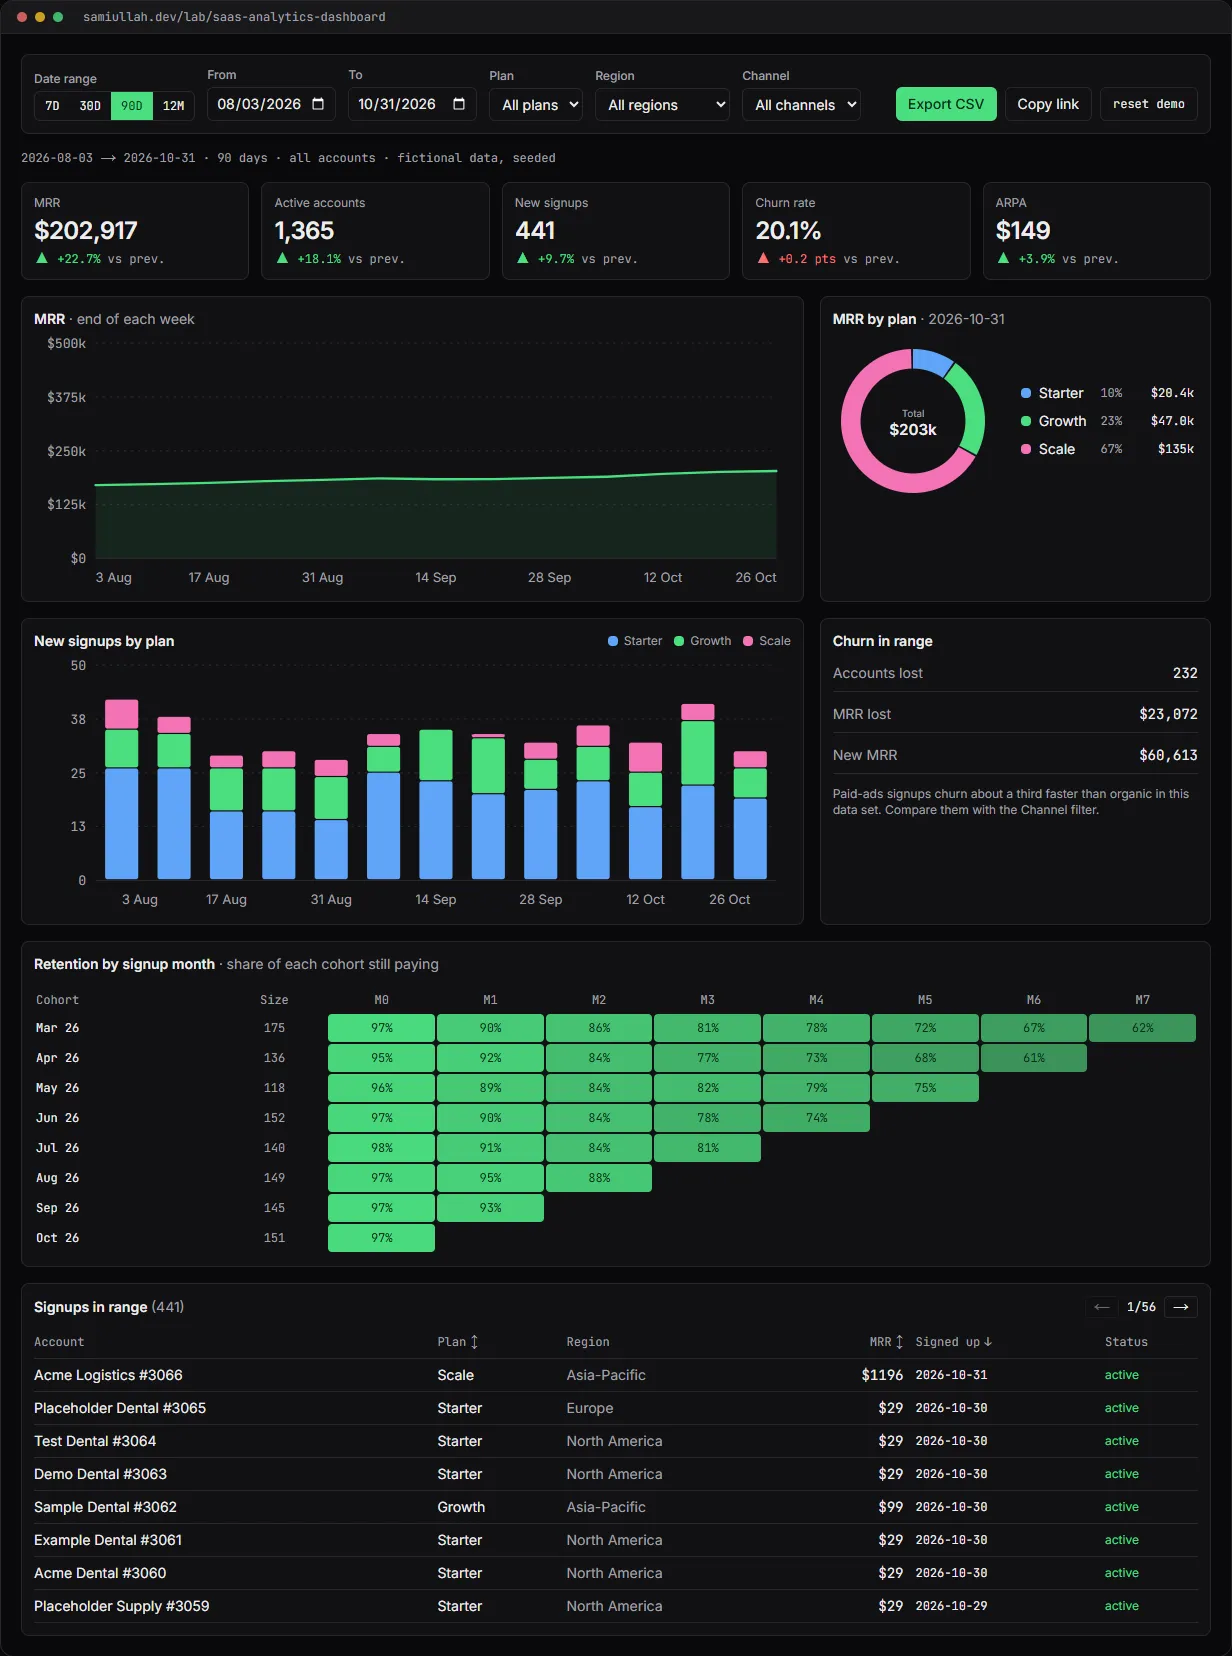
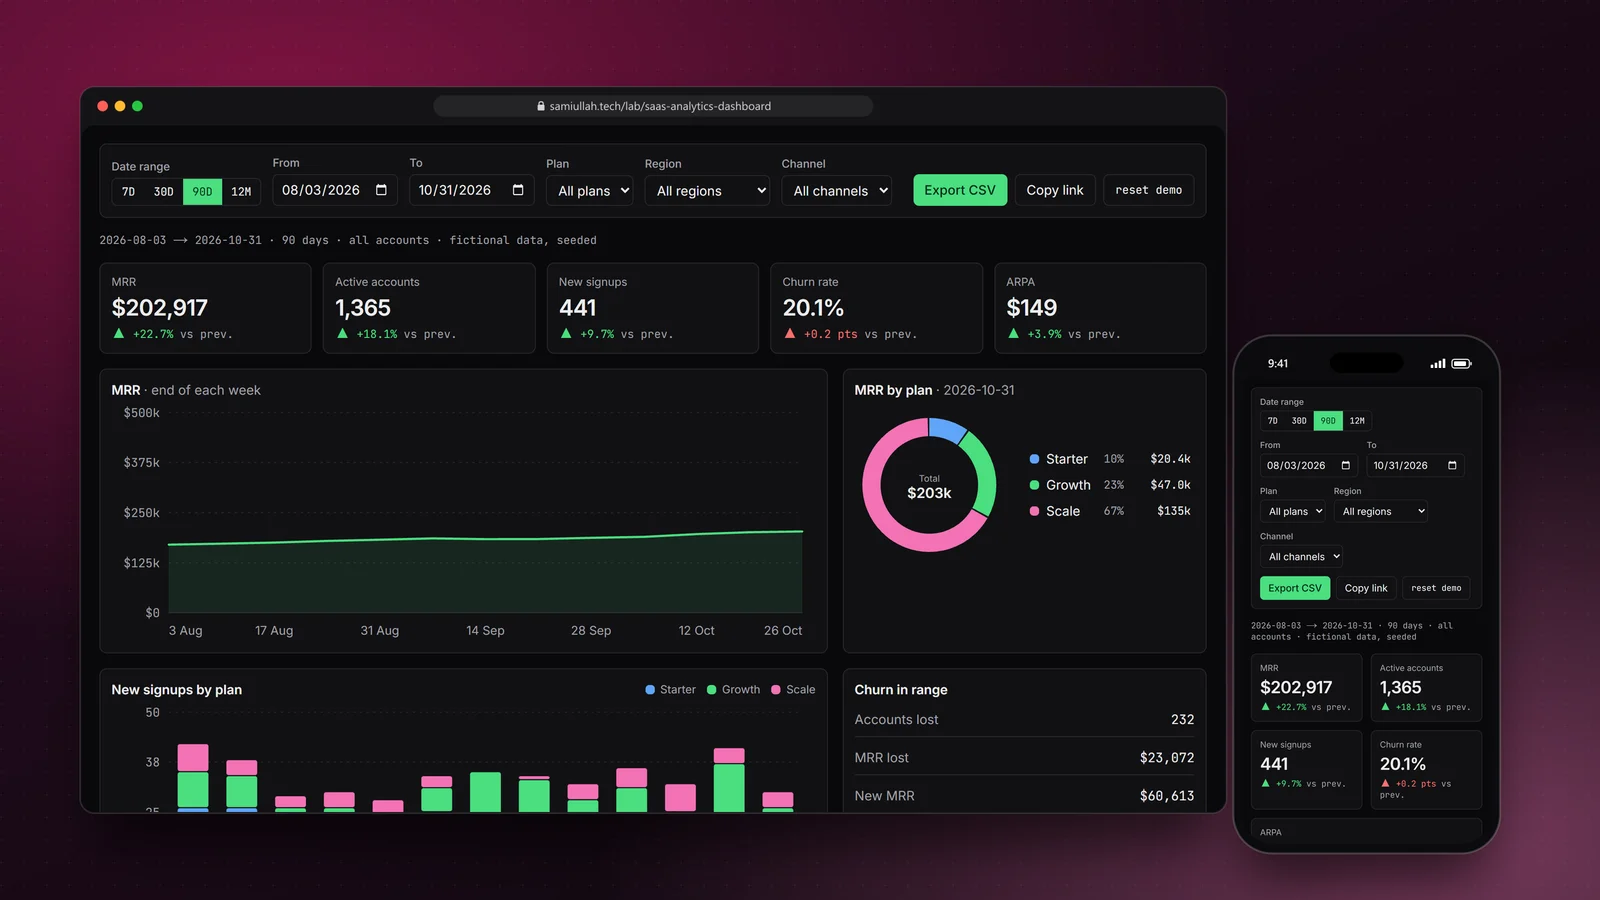
A concept project with a working demo: a SaaS analytics dashboard with MRR, churn and ARPA tiles, hand-written SVG charts with tooltips, date-range and segment filters, a cohort retention table and CSV export. All numbers come from seeded fictional data generated the same way on the server and in the browser.
Overview#
Every subscription business opens the same page in the morning: how much recurring revenue there is, how many accounts are paying, who signed up and who left. The page looks simple. The work is in getting the numbers right for any date range and segment, and making the charts readable by everyone.
This concept is that page, working. The live demo covers 18 months of fictional subscription data, five KPI tiles, three charts, a cohort retention table, a sortable signup table and CSV export. Filters live in the URL, so a view can be shared.
My role#
Everything: the data generator, the metric definitions, the aggregation code, the SVG charts, the layout and this write-up. It is a concept project, not client work. The accounts are generated, with names such as "Acme Dental #1042".
The problem#
Dashboards go wrong in three common ways:
- Numbers that do not add up. "Churn rate" means different things to different people. If the definition is not written down, two charts on the same page can disagree.
- Slow filters. Recomputing everything from raw events on each click makes the page feel broken as data grows.
- Charts only some people can read. A line with no values, colour as the only way to tell series apart, and a tooltip that needs a mouse.
I also wanted the demo data to be the same on every load, so the charts can be rendered on the server and so anyone can check a number by hand.
Approach & architecture#
- Seeded PRNGthen
- ~2,000 accountsthen
- daily deltas per segmentthen
- prefix sums
- prefix sumsthen
- KPI tiles (range vs previous range)
- prefix sumsthen
- buckets (day / week / month)then
- line + stacked bars + CSV
- accountsthen
- breakdown at range endthen
- donut
- accountsthen
- monthly cohortsthen
- retention table
Deterministic data. data.ts generates accounts with mulberry32, a small seeded PRNG. Daily signups follow a growth trend with fewer weekend signups and a launch bump in February 2026. Each account gets a plan, region and channel, and a lifetime drawn month by month from a churn rate that depends on the plan and channel. I avoided Math.exp and Math.log in the generator so every JavaScript engine gives byte-identical output, which keeps server and client renders equal.
Deltas and prefix sums. For a segment, each account adds its MRR on its signup day and removes it on its churn day. One pass builds the daily delta arrays, one more turns them into running totals:
for (const a of accounts) {
  if (!inSegment(a, seg)) continue;
  mrrDelta[a.signupDay]! += a.mrr;
  activeDelta[a.signupDay]! += 1;
  signups[a.plan][a.signupDay]! += 1;
  if (a.churnDay !== null) {
    mrrDelta[a.churnDay]! -= a.mrr;
    activeDelta[a.churnDay]! -= 1;
    churned[a.churnDay]! += 1;
  }
}
After that, MRR on any day is an array lookup, so changing the date range does no new aggregation at all. Only a segment change rebuilds the arrays.
Written-down definitions. Each KPI compares the range with the period of the same length right before it. Churn rate is accounts lost in the period divided by accounts active at its start. ARPA is MRR divided by active accounts. The definitions are in kpis() and on each tile's tooltip.
In the production design the same shapes come from SQL:
-- in the production design: MRR at the end of each day for one workspace
SELECT d::date AS day,
       SUM(s.mrr) FILTER (WHERE s.started_at <= d AND (s.ended_at IS NULL OR s.ended_at > d)) AS mrr
FROM generate_series($1::date, $2::date, interval '1 day') AS d
CROSS JOIN subscriptions s
WHERE s.workspace_id = $3
GROUP BY d
ORDER BY d;
For long ranges I would precompute a daily rollup table in a nightly job, which turns that query into a plain range scan.
Key challenges#
- Buckets that match the range. A 7-day view needs days, a 12-month view needs months.
buckets()picks day, week or calendar month from the range length, and the CSV export uses the same buckets so the file matches the chart. - Charts without a library. The line, stacked bar and donut charts are plain SVG with a fixed
viewBox, so they scale from phone to desktop. Axis maximums are rounded to 1, 2 or 5 × 10ⁿ so the tick labels stay readable. - Accessible charts. Each chart is focusable. Arrow keys move the tooltip one period at a time, Home and End jump to the ends. Each one has an
aria-labelsummary and a visually hidden table with every value. The stacked bars have a legend and a gap between segments, so colour is not the only cue. - Shareable views. The range and segment are written to the query string with
history.replaceState. Opening a copied link restores the same view; without a query the last view comes fromlocalStorage. - A segment-aware donut. When you filter to one plan, "MRR by plan" would be a single full ring. The donut switches to region, and then to channel, as filters are applied.
Tech stack#
- Demo: TypeScript, React 19 and Next.js. Hand-written SVG charts, no chart library. Data generation and every aggregation are in framework-free modules (
data.ts,metrics.ts). - Production design: Next.js server components calling a Node.js API that runs the aggregations in PostgreSQL, with a nightly rollup table and short-lived caching per workspace and range.
Results#
- A working dashboard: five KPI tiles with period comparison, an MRR line chart, signups stacked by plan, a segment-aware donut, a cohort retention heatmap and a sortable, paginated signup table.
- Every number recalculates for any date range and any combination of plan, region and channel, and can be exported as CSV.
- The data is generated from a fixed seed, so the numbers are the same for every visitor and anyone can check them against the CSV.
- All charts can be read by keyboard and by screen reader through their hidden tables.
This is a concept build on generated data without real users or customers, so it makes no claims about business results.
Try the demo#
Open the SaaS analytics dashboard demo. Things to try:
- Switch between 7D and 12M and watch the charts change from daily to monthly buckets.
- Set Channel to "Paid ads", then to "Referral", and compare the churn rate tile and the retention table.
- Click the MRR chart, then use the arrow keys to read each period's value.
- Press Copy link, open it in a new tab, and press Export CSV to check the numbers.
What I would do next#
- Move the aggregations to SQL behind a cached API and add a rollup table for ranges longer than 90 days.
- Add Vitest tests that check each KPI against a hand-built set of accounts.
- Model plan upgrades and downgrades, so MRR movement can be split into new, expansion, contraction and churn.
- Add a comparison mode that overlays two segments on the same chart.