Concept project
NDVI Time-Series Viewer
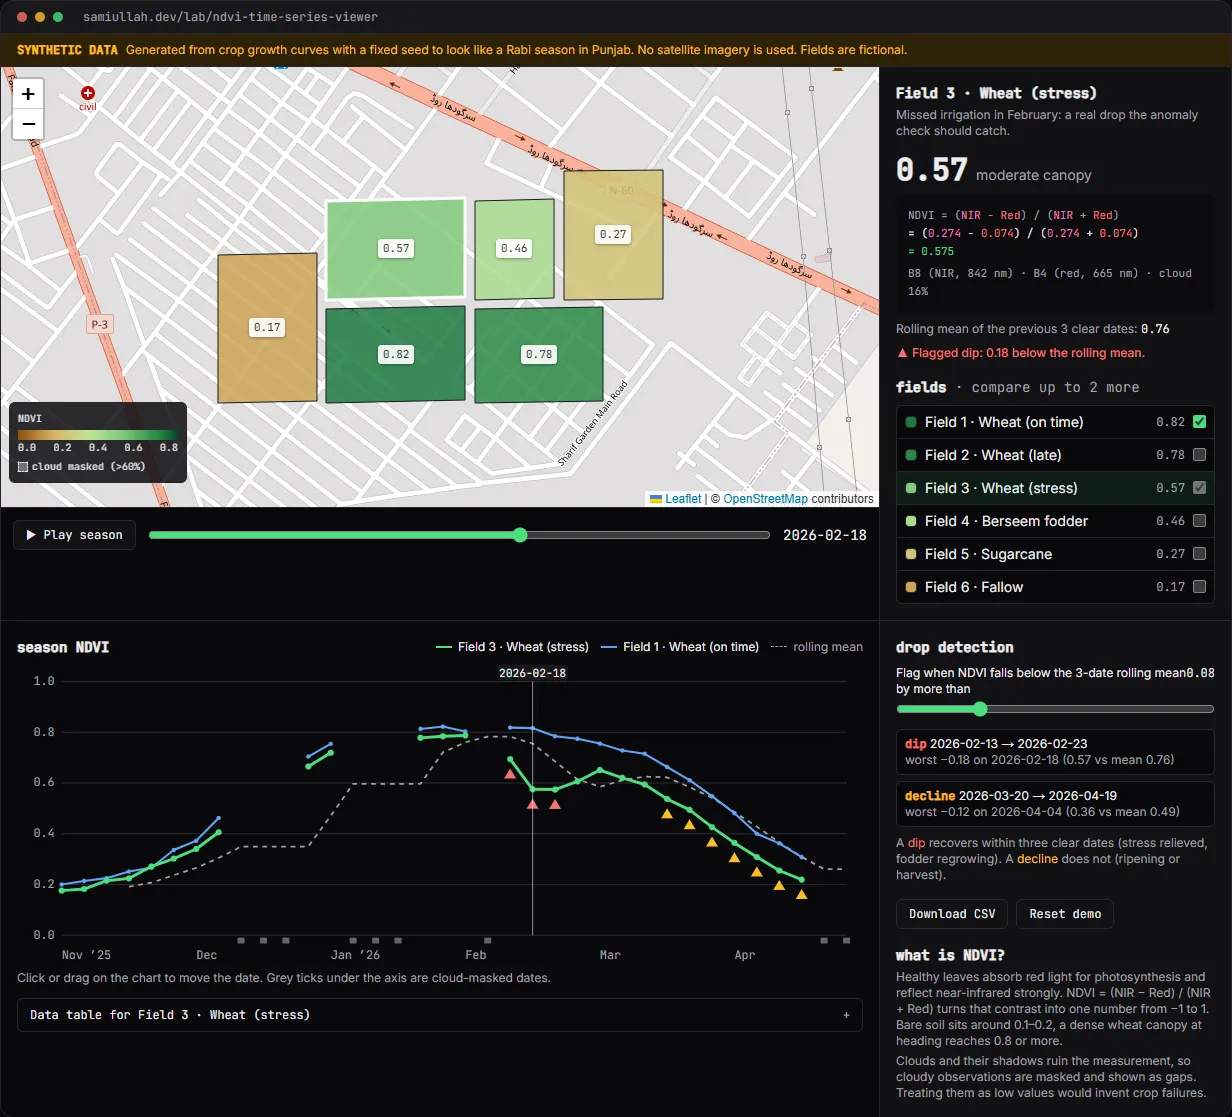
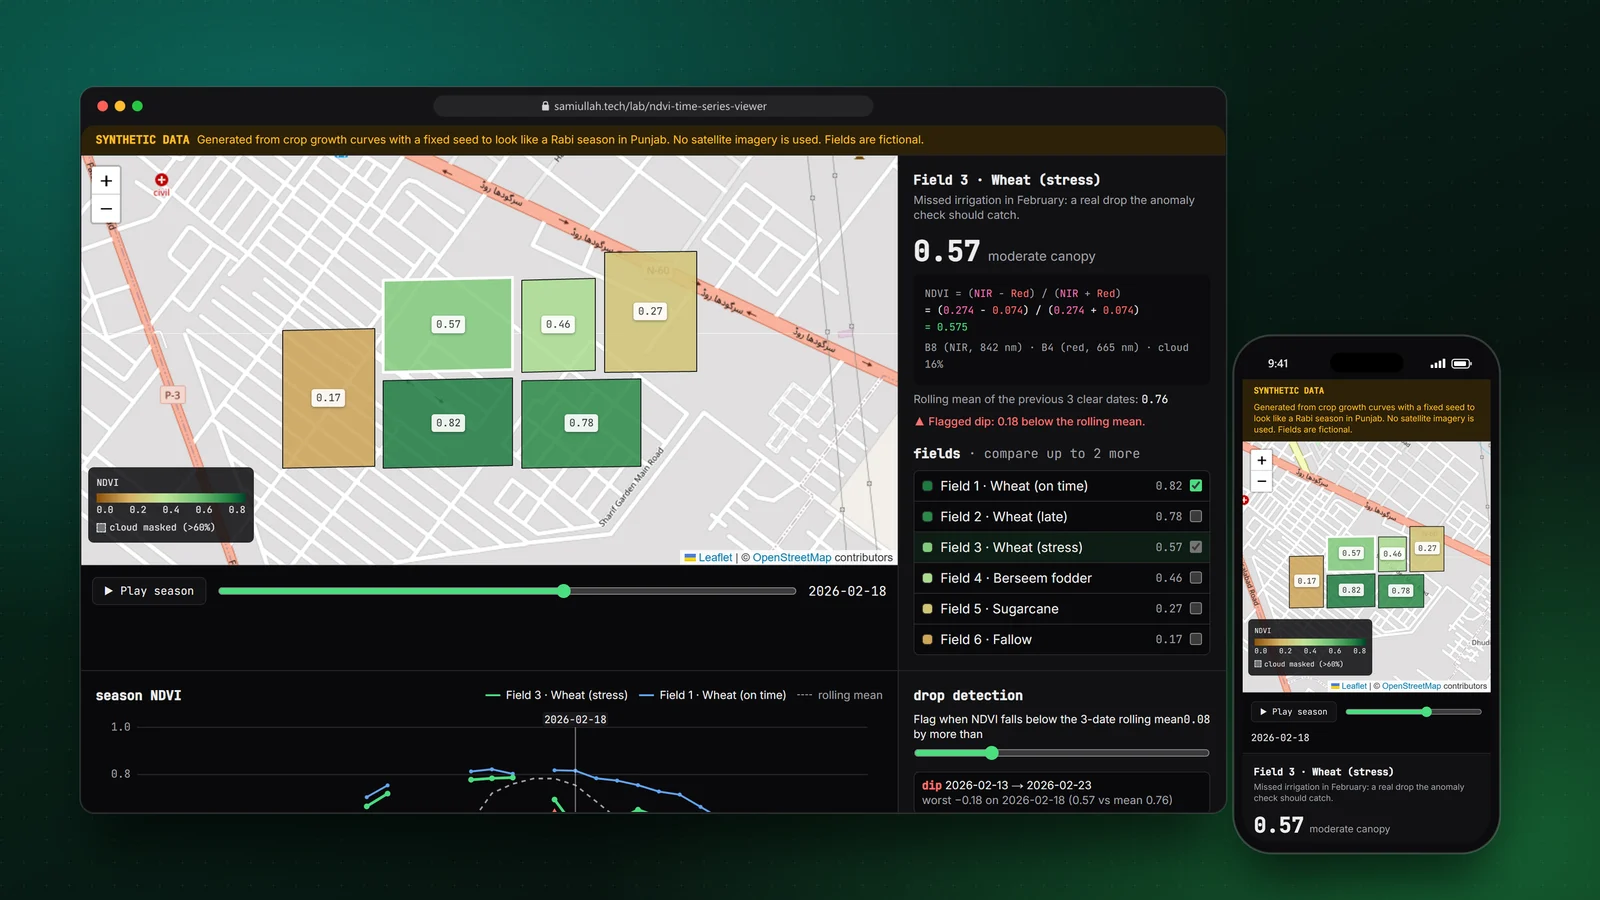
A concept project with a working demo: an NDVI viewer that colours fields on a map by crop vigour for any date in a season, charts each field's curve with cloud gaps, and flags drops against a rolling mean. It runs on clearly labelled synthetic data built from crop growth curves, so the logic is visible without satellite downloads.
Overview#
NDVI is the number most crop-monitoring products show first. It is calculated from two bands of satellite imagery, red and near-infrared, and it rises as a crop canopy gets denser and greener. One value on one date is not very useful. The value is in the curve over a season, and in noticing when a field leaves its expected curve.
This concept shows that view: a map of fields coloured by NDVI on a chosen date, a chart of each field's season, and a simple detector that flags sudden drops. The live demo runs on synthetic data, and says so on the page. It is close to the geospatial work I do in my job, rebuilt here from public knowledge only.
My role#
I designed and built everything: the synthetic data generator, the anomaly rules, the SVG chart, the map colouring, the colour scale and this write-up. I picked synthetic data on purpose. A real Sentinel-2 export would need licensing notes, a processing pipeline and real farm locations, and none of that is needed to show the front-end and analysis logic.
The problem#
A season of NDVI looks simple until you try to act on it:
- Clouds. Punjab in December and January has fog and western disturbances. A cloudy pixel gives a low NDVI, which looks exactly like a dying crop. Plotting it as a value invents a crisis.
- Normal drops. Wheat ripens and NDVI falls by half over March and April. Berseem fodder is cut every few weeks. Sugarcane is harvested. A naive "NDVI fell" alert fires on all of these.
- Comparing fields. A late-sown field peaks two weeks after its neighbour. Without seeing both curves together, the late field looks weak in January when it is simply behind.
- Explaining the number. Users ask "what does 0.62 mean?" The interface has to show the formula and the bands, not just a colour.
Approach & architecture#
- New Sentinel-2 L2A scenethen
- cloud mask (SCL)then
- clip B4 and B8 to field polygonsthen
- mean per fieldthen
- ndvi_observations table
- ndvi_observationsthen
- API /fields/:id/ndvithen
- chart + map colouringthen
- drop detectorthen
- agronomist alert
- Growth curve per crop + seeded noisethen
- red/NIR pairthen
- NDVIthen
- cloud maskthen
- chart, map, detector
In the demo, ndvi.ts generates each field's season from a double-logistic curve (green-up, then senescence), adds seeded noise and a regional cloud model that is cloudier in winter, then turns each target NDVI into a plausible red and NIR reflectance pair. The UI computes NDVI back from those bands, so the formula panel shows real arithmetic.
The detector compares each clear observation with the mean of the previous three clear ones. Masked dates are skipped, never treated as zero:
export function findAnomalies(series: Observation[], threshold: number, window = 3): Anomaly[] {
  const means = rollingMean(series, window);
  const out: Anomaly[] = [];
  series.forEach((o, i) => {
    const mean = means[i];
    if (o.ndvi === null || mean === null || mean === undefined) return;
    const drop = mean - o.ndvi;
    if (drop > threshold) out.push({ index: i, date: o.date, value: o.ndvi, mean: round(mean, 3), drop: round(drop, 3) });
  });
  return out;
}
A plain rolling-mean rule flags every date of normal ripening. So findEpisodes groups consecutive flags and checks what happens next. If NDVI climbs back by at least half the threshold within three clear dates, it is a dip (stress relieved, a fodder cut regrowing). If not, it is a decline (ripening or harvest). On the default threshold the stressed wheat field shows one dip in February and one decline at the end of the season, which is the right story.
In the production design, observations are stored per field and date:
CREATE TABLE ndvi_observations (
  field_id    uuid NOT NULL REFERENCES fields(id) ON DELETE CASCADE,
  scene_date  date NOT NULL,
  red_mean    real,
  nir_mean    real,
  ndvi_mean   real,
  cloud_pct   smallint NOT NULL,
  PRIMARY KEY (field_id, scene_date)
);
Key challenges#
- Gaps, not zeros. The chart builds its SVG path by lifting the pen at every masked date. The map draws masked fields dashed and grey, and the table writes "masked". It took a few passes to make sure no code path turned
nullinto0. - A colour scale that reads for everyone. Red-to-green ramps fail for the most common colour-vision deficiency. I used a brown to yellow-green to dark green ramp with numeric labels on the legend, and every value is also printed on the map and in the list.
- Deterministic synthetic data. Next.js renders on the server first. The generator uses a seeded PRNG (mulberry32), so server and browser produce the same numbers and there is no hydration mismatch.
- Making the detector honest. I tuned the episode rule against the six fields and wrote down what each one should produce before looking at the output: one dip for stressed wheat, three cut dips for berseem, a harvest drop for sugarcane, nothing for fallow.
Tech stack#
- Demo: TypeScript, React and Next.js, Leaflet with OpenStreetMap tiles, a hand-written SVG chart. No chart library.
- Production design: a Node.js batch job that reads Sentinel-2 L2A scenes, computes zonal means per field with PostGIS or a raster library, and writes to PostgreSQL; an API that serves a field's series to the same chart component.
Results#
- A working viewer: date scrubber and playback, map colouring with legend, chart with up to three fields, rolling mean, flagged episodes, data table and CSV export.
- The detector separates the stressed field's February dip from end-of-season ripening, and explains every flag with the numbers it used.
- The NDVI formula panel shows the band values and arithmetic for the selected field and date.
- All analysis code is under "View source" on the demo page.
The data is synthetic and there are no users. This is a concept build that shows how I would structure the feature, not a measurement of any real farm.
Try the demo#
Open the NDVI viewer demo. Things to try:
- Press Play season and watch the fields green up, then ripen. Grey dashed fields are cloud-masked dates.
- Select "Field 3 · Wheat (stress)" and look at the red triangles in February.
- Tick "Field 2 · Wheat (late)" to compare: its curve is shifted, not weaker.
- Move the threshold slider to 0.04 and see how many more drops get flagged.
What I would do next#
- Replace the generator with a real Sentinel-2 export for public sample plots, with the required Copernicus attribution.
- Compare each field with same-crop neighbours on the same date, which is a stronger signal than its own history.
- Add a raster layer so users can see the variation inside a field, not only the field mean.
- Add unit tests for the gap handling and the episode rule with recorded fixtures.